Many people are lamenting the new intentional walk rule, suggesting it will send baseball plunging toward a state where it is no long recognizable. Meanwhile, we just finished our third season with the instant replay challenge system, which already feels commonplace. The exact nature of the system has changed over the three years, but the basic idea remains the same: managers can challenge umpires’ calls on certain plays, with the ultimate goal of getting more calls right. The system is not perfect. For example, it is odd that getting a call made correctly is something of a strategic consideration, but it is, and is still better than letting incorrect calls stand and/or wasting time with manager-vs-umpire histrionics. While not ideal, the strategic aspect of the system does allow for an evaluation of how well managers/teams exert their replay challenge power. With that in mind, let’s have a look at how John Farrell and his staff fared with their challenges in 2016.
Before getting to Farrell specifically, some context: during the 2016 season there were 1501 plays reviewed – 168 were initiated by the umpiring crew. This total is derived from the Baseball Savant Instant Replay Database. I will note that there are a few duplicate entries in the database shown on the Savant website, so the numbers I give here will differ slightly from those which you will find there. There was also one review at the All-Star Game but I am ignoring it. Of the 1501 reviews, 772 (51.4%) resulted in the call being overturned. The plays that get reviewed tend to be close calls: bang-bang plays at first base, tag plays where the runner bounces off the bag for a fraction of a second, home runs that just clear the wall (or don’t). The human perceptual system has limits and in these situations I suspect the umpires are really just guessing. So the coin-flip rate of overturned calls is not all that surprising. On a more positive note, having this system in place meant that 772 plays were enforced correctly, which would not have been the case four years ago.
I offered examples of plays that are likely to be challenged, but below is the actual breakdown of the play-types that were challenged by managers at least five times in 2016.
|
Type |
MLB |
Red Sox |
|
Catch or drop |
14 |
- |
|
Fair or foul in outfield |
24 |
- |
|
Fan interference |
12 |
- |
|
Force play |
91 |
5 |
|
Hit by pitch |
75 |
3 |
|
Home-plate collision |
31 |
- |
|
Play at 1st |
441 |
15 |
|
Slide interference |
35 |
2 |
|
Tag play |
571 |
23 |
|
Tag-up play |
12 |
- |
|
Touching a base |
7 |
- |
|
Trap play |
8 |
- |
It is not too surprising that tag plays and plays at first are challenged most often by far, as they happen most frequently.
How about the Red Sox specifically? Excluding the umpire-initiated reviews, the Red Sox were involved in 93 replay reviews. John Farrell and his staff asked for a review 48 times, which was the 15th most last year and slightly above the league average. As you can see in the table above, they distributed their challenges across play types in much the same way as the rest of the league. The other 45 replay reviews that involved the Red Sox came when an opposing manager challenged a play in a game against them. Again, that was right around league average. Teams seemed to have it in for the Cubs. They endured a league-leading 69 reviews against them. Second most was the White Sox with 59. Maybe it is just an anti-Chicago thing, or maybe umpires are a mess while in the windy city.
Back to the Red Sox. When they asked for a play to be reviewed, they did not fare very well. Only 22 of their 48 challenge requests (45.8%) resulted in a call being overturned. I recognize that the video review team and coaching staff are time-limited in initiating their challenge, but I expected the advantage of having video to review would have produced better results. I suppose those dastardly limits of the human perceptual system are still affecting things; one can only do so well even with frame-by-frame access. Still, other teams did much better. The Red Sox’s overturn rate was well below league average and ranked 26th in the game. To better see how they fit in with the rest of the league, here is a plot showing overturned percentage against the number of calls challenged.
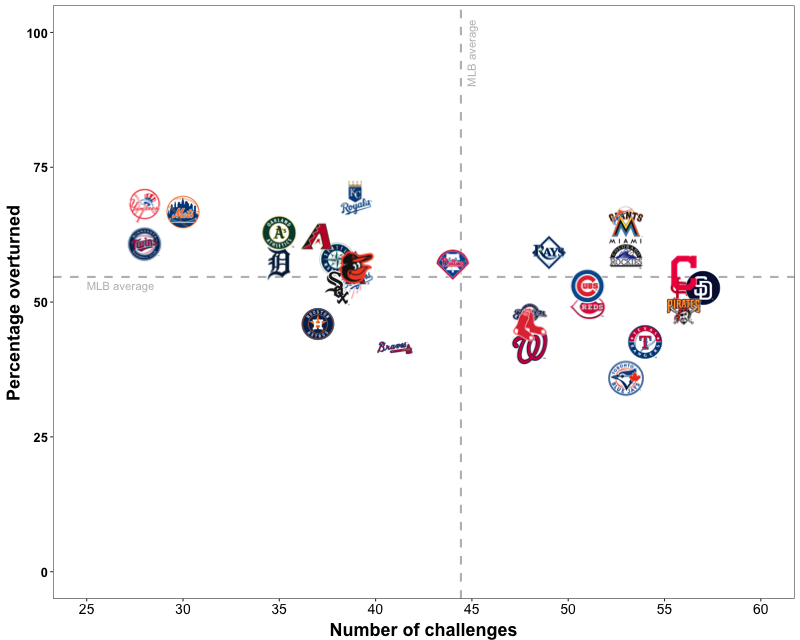
Being in the upper-right section of this figure is ideal: you challenge a lot and you are successful. With that in mind, it looks like the Giants, Marlins, Rockies, and Rays were the best at using the replay challenge system last season. Andy Green and the Padres were the most frequent challenger, asking the umpires to check things out 57 times. Ned Yost and the Royals were below average in terms of frequency, but were the most successful, just barely edging Joe Girardi and the Yankees. The Yankees, Twins, and Mets were the least likely to ask the umps to grab the headsets, but were successful when they did; perhaps they should consider challenging more often. If they do, they should avoid getting into John Gibbons country. Gibbons and the Blue Jays challenge a lot but have by far the worst success rate.
The number of challenges a manager issues and his success rate offers a sort of binary evaluation of how managers use the system (challenge: yes/no; result: upheld/overturned), but not all challenges are made equal. Different game states may lend themselves to being more challenge-worthy and the result of the challenge could really swing an inning. Thus the value of a challenge is more than just right-or-wrong. One way to approximate the value is through the lens of run expectancy. This is something I did following the 2014 season, the first to use the replay challenge system. Win expectancy would probably be better, as leverage likely has a role in determining if a manager will challenge or not, but run expectancy gets us most of the way to determining value and is much easier to implement. With this approach, the value (in runs) of a correct call is determined by calculating the difference between a team’s run expectancy had the play remained as called on the field, and the team’s run expectancy after the result of the replay review. As such, this is only relevant for calls that are overturned; they are the only plays where the system had an effect on a team’s run expectancy in an inning.
For example, let’s say your favorite team has the bases loaded with one out. The batter grounds a ball to the shortstop who starts a 6-4-3 double-play to end the inning, preventing any runs from scoring. The batting team’s run expectancy is now zero (the inning is over). But the play at first was close enough that the manager of the batting team asks for a review. After the review it is determined that the batter actually beat the play at first and should be ruled safe. This means that rather than the inning being over, the batting team has scored a run and now has runners at first and third with two outs, which, according to BP’s matrix for 2016, has a run expectancy of 0.4809. All told, this means the replay review system awarded the batting team (and penalized the defense) one run and 0.4809 expected runs. So the value of the review to the batting team is +1.4809 runs – I italicize runs because the analysis is based on average run expectancy values, and not necessarily actual runs scored. This might sound contrived, but it is exactly the situation of the Red Sox’s review that resulted in the largest shift in their run expectancy:
To see just how much the replay review system helped or hurt the Red Sox from a run expectancy perspective, I parsed the play-by-play account and/or watched the overturned calls that were initiated by a manager and involved the Red Sox. I am not looking at the umpire initiated reviews because I am most interested in the managerial strategic aspect of the system. This means I looked at the 22 calls that John Farrell and company got overturned through challenges and the 22 times when the Red Sox were the victims of another team’s successful challenge. For every winner there must be a loser. As in the example above, the base-out situation given the call on the field was taken as the initial run expectancy, and the base-out situation resulting from the overturning of the call was used as the end run expectancy. Any runs scored (or taken back) were accounted for in the calculation. In all cases the absolute difference in run expectancy was recorded.
All right, so let’s get to down to it. From this analysis I found that Red Sox’s challenges netted them 14.5 runs. These runs were almost evenly split between increasing run expectancy when they were on offense (8.3) and decreasing the oppositions’ run expectancy when the Red Sox were on defense (6.2). That seems pretty great. While they were not standouts in terms of success rate, the Sox gained substantial opportunity with their challenging. But as I mentioned above, for every winner there is a loser and we need to consider that the Red Sox were “victims” of the replay challenge system just as many times as they were victors. Being on the wrong end of an opposing manager’s successful challenge cost the Red Sox 13.7 runs; almost everything they got from challenging was given back. They lost 8.5 runs on offense and 5.2 runs on defense. The second most costly challenge against the Red Sox came in the first inning of Game 1 of the ALDS against Cleveland, when Brock Holt was deemed out at the plate after review (change in Red Sox’s RE: -1.3174). Now, I did not evaluate every team’s challenge-based run expectancy plus-minus, so I cannot speak to where the Red Sox’s +0.8 total places them relative to the league, but I suspect it is around the average. You get a few calls in your favor, you have a few calls go against you: the human element, now with technology.
As that last sentences alludes, ending the year with positive runs or negative runs likely involves a lot of luck. Umpiring errors (or perceived errors) are (hopefully) randomly distributed, so there is no reason that any team should expect to have more challengeable calls than another. But when challengeable calls happen in critical moments there are large shifts in run expectancy at stake, and therefore ensuring that challenge decisions are being made optimally (or as close to it as possible) is worthwhile. Of course I should also note that my review here is limited to calls that were actually challenged. There were likely many calls that were worthy of a challenge but were not challenged. Perhaps Farrell was out of challenges, or just too hesitant to pull the challenge trigger. I can’t really comment on that issue. Regardless, given what we know about when the Red Sox did challenge, it seems like they could be better than they were, and this success rate, as well as the value of their challenge outcomes, is something to track in 2017.
Photo by Bob DeChiara/USA Today Sports Images