David Ortiz was projected by PECOTA to post a .307 True Average, and he’s stayed near or above .300 in all but one of his 11 other seasons with Boston. Now, after playing in 50 games this season, David Ortiz holds a mediocre TAv of .246. As Alex Skillin explained here not long ago, there’s some part of this that fits into a bigger picture — we’ve seen the 39-year-old Ortiz in a slow, steady decline for a few years now.
One month later, it’s starting to look less like Ortiz is rolling downhill, and more like the wheels have come off. Still, it’s hard to shake the feeling that we’ve seen this before. After a wrist-clickingly-poor 2008, Ortiz hacked his way to a triple slash of .196/.289/.309 (.252 BABIP) through 50 games in 2009 — a power-free version of the .229/.299/.379 line he sports right now. Slumps in the Aprils of 2008 and 2010 were almost identical to that extended version in 2009, all of which seemed to signal that the end was near (and helped make this happen, too).
It didn’t quite turn into an annual tradition, though — the Ortiz Early Season Slump went on hiatus for more Red Sox games than Brian Daubach ever played in. Alex nailed it: most likely, what we’re seeing is a combination of random struggles and Father Time back taxes. Sometimes “extended slump” is its own explanation. But there are some similarities between the Ortiz Early Season Slump and this one, even if they really don’t explain what we’re seeing now.
2009 Problems: A Hitch Ain’t One?
From a batted ball perspective, Ortiz’s claim to fame is that his fly balls have tended to do especially well (.968 slugging for his career). Ortiz has tended to hit the ball in the air more than the average hitter, but according to the BIS batted ball data at FanGraphs, it’s not like he’s had especially good success at hitting line drives.
| Type | Grounder | Line Drive | Fly Ball |
| Percent of batted balls (MLB Average in 2014) | 36.1% (44.8%) | 20.2% (20.8%) | 43.7% (34.4%) |
| BABIP | .213 | .692 | .166 |
We expect a BABIP on line drives around .700; nothing too special there. In the four Early Season Slump months, however, Ortiz had far less success on line drives in particular: .610 BABIP. On first blush, it does look like the slumps line up with an increased pull rate on line drives and grounders, suggesting defensive shifts could shoulder some blame. Take a look at these numbers, with average batted ball angle (positive is to right field) for ground balls and line drives from Baseball Heat Maps:
| Year | Angle | Distance | BABIP | GB BABIP | GB Pull | LD BABIP | LD Pull | TAv |
| 2007 | 12.08 | 177 | 0.355 | 0.292 | 61.3% | 0.701 | 53.3% | 0.345 |
| 2008 | 14.74 | 174 | 0.27 | 0.206 | 60.3% | 0.692 | 50.8% | 0.285 |
| 2009 | 15.44 | 159 | 0.262 | 0.165 | 66.2% | 0.648 | 52.8% | 0.263 |
| 2010 | 12.67 | 160 | 0.313 | 0.218 | 61.3% | 0.734 | 52.3% | 0.29 |
| 2011 | 11.68 | 151 | 0.321 | 0.209 | 61% | 0.716 | 44.2% | 0.307 |
| 2012 | 9.08 | 173 | 0.316 | 0.208 | 60.4% | 0.655 | 33.9% | 0.343 |
| 2013 | 13.23 | 180 | 0.321 | 0.232 | 59.5% | 0.673 | 53.1% | 0.332 |
| 2014 | 13.24 | 182 | 0.256 | 0.178 | 68.8% | 0.63 | 50% | 0.306 |
| 2015 | 9.36 | 172 | 0.235 | 0.127 | 63.4% | 0.576 | 20.6% | 0.246 |
When looking specifically at the slump months, however, it’s actually the opposite. From Baseball Heat Maps, here’s the average batted ball angle for line drives (left) and ground balls for 2008 and 2009:
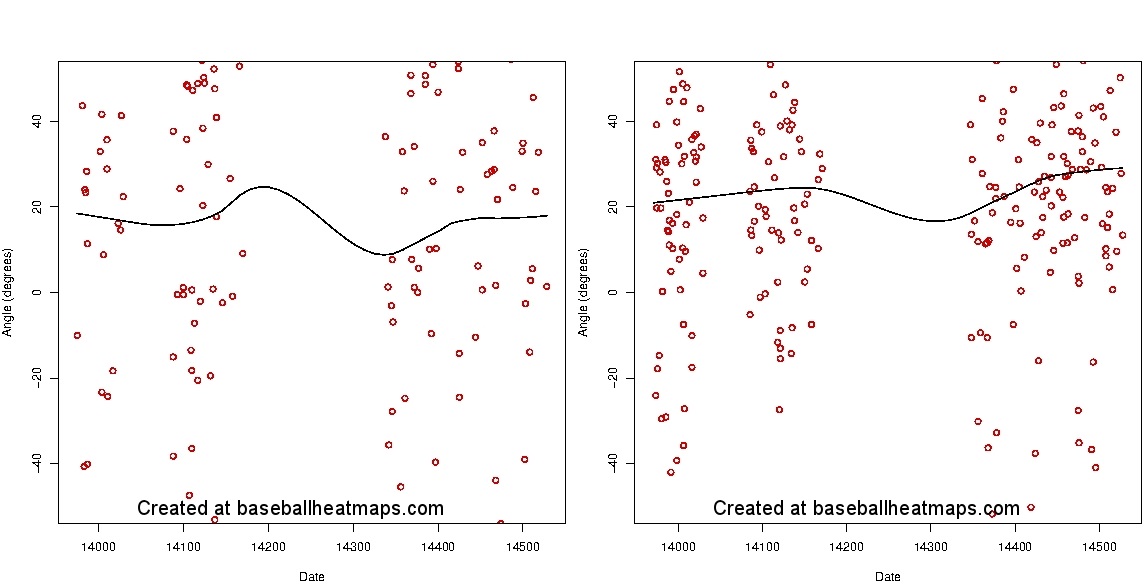
The 2009 part of the curve — showing that Ortiz’s average spray angle on grounders and liners was more toward center field during his slump — tracks with his ground ball percentage overall. Ortiz finished that 2009 season with a ground ball percentage of 32.1%, the second-lowest of his career, after a 23.2% rate in April and a 29.2% rate that May. Ortiz hit into a whole bunch of popups during that slump, with just one home run (in May). Once Ortiz started pulling the ball more and hitting more ground balls, the home runs came back.
The last time Ortiz was mired in a two-month slump to start the season, his ground ball percentage may have been too low, not too high.
Although Ortiz’s line drive percentage during the 2009 slump was just fine, we might infer from the lower pull rate that Ortiz wasn’t hitting the ball as hard. One thing that results in lower batted ball velocity: bat speed. That would also fit the increased popup rate; with the loft in his swing, if Ortiz were swinging late, he’d be swinging under. Ditto for the low ground ball rate, as ground balls are frequently a function of swinging too early.
That’s just not what’s happening to Ortiz right now. His 44.7% GB% so far this year would be the highest of his career — by far. In the fairly distant past, Ortiz seemed to pull ground balls when going well. But right now, ground balls are one of the four horsemen of the DH apocalypse.
2015: Slump Sequel or Epilogue?
With that revelation, we know there’s something else going on here. The ground ball percentage has something to do with it, but that would be an unusual way for a power hitter to go out. If this is about age, then we’d expect a slower bat — a higher ground ball percentage points in the other direction, thanks to that loft-and-early likelihood.
As Matt Kory recently noted at FanGraphs, however, struggles against lefties seem to be taking Ortiz down. Just for the sake of review: a .095 TAv is bad.
| Year | vL TAv | vR TAv | vL BABIP | vR BABIP | vL GB% | vR GB% |
| 2007 | 0.289 | 0.371 | 0.352 | 0.357 | 44% | 34.90% |
| 2008 | 0.246 | 0.298 | 0.22 | 0.288 | 38.64% | 36.05% |
| 2009 | 0.236 | 0.274 | 0.248 | 0.268 | 43.90% | 26.80% |
| 2010 | 0.201 | 0.334 | 0.307 | 0.317 | 48.06% | 34.98% |
| 2011 | 0.322 | 0.299 | 0.371 | 0.298 | 43.57% | 40.59% |
| 2012 | 0.335 | 0.348 | 0.333 | 0.306 | 35.29% | 37.36% |
| 2013 | 0.257 | 0.375 | 0.278 | 0.348 | 41.82% | 39.26% |
| 2014 | 0.308 | 0.305 | 0.275 | 0.247 | 39.44% | 37.98% |
| 2015 | 0.095 | 0.318 | 0.143 | 0.289 | 44.64% | 45.63% |
Really bad. And in this case, maybe it’s not a matter of Ortiz getting out in front — maybe he’s just guessing against lefties at this point. Against LHP, Ortiz is swinging and missing at 12.1% of pitches outside the strike zone — as opposed to 10.2% in 2009, when his lefty struggles were also very pronounced.
If this is the beginning of the end for Ortiz, it’s not for the same reasons he struggled after his wrist injury in 2008. And so we’re back to the conclusion that this is about not even Ortiz lasting forever. There’s losing bat speed, but there’s also losing precision at the plate — and in combination with Ortiz’s increased popup rate so far this season, the suddenly-high ground ball percentage might tell us that. If Ortiz’s bat-to-ball skill were eroding, it might look just like this.
In terms of getting on track this year and planning for a possible Ortiz role in 2016, we may be coming up on the right time to throw in the towel with lefties entirely. In 2014, Ortiz accounted for 53.5% of all plate appearances by a lefty DH against a lefty pitcher, all by himself. Ortiz can’t make the same claim so far this year — he’s responsible for just 30% of all lefty-DH-on-lefty violence, with Prince Fielder moving off of first and Adam LaRoche soaking up time in Chicago (no other lefty DH has more than 5 PA against LHP).
And the fact that other teams have moved away from the full time DH model may be the point. Things are going poorly for Ortiz this year, but should the Red Sox commit to a platoon at DH, even his current numbers suggest that his batting rates may start to turn around very quickly. When he doesn’t start, he’ll still be available. There may not be many full time lefties at DH anymore, but there aren’t too many lefty closers, either.
Photo by Kevn Jairaj/USA Today Sports Images