With 76 games in the books as of Saturday night, the Red Sox are closing in on the halfway point this season. With a .266 True Average, the team ranks 15th at the plate. In the field, it ranks just 22nd in Defensive Efficiency (.695, or 69.5% of balls in play turned into outs). A 4.45 ERA ranks the pitching staff 28th in the sport, and while Red Sox pitchers haven’t really been as bad as that (a 4.02 Deserved Run Average ranks them 11th in MLB), they aren’t exactly propping up the team, either.
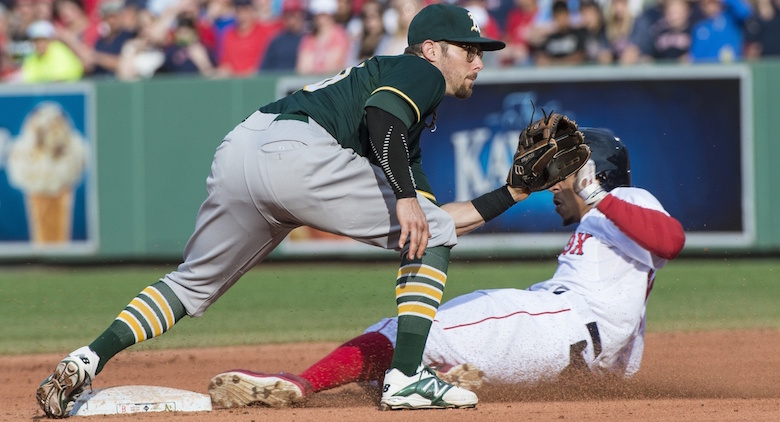
But one area in which the Red Sox have excelled? Baserunning. Baseball Prospectus’ Baserunning Runs statistic has the team 7th in baseball at 4.2 BRR, which also happens to rank second in the American League. Huzzah! Maybe a half a win is nothing to get too excited about, but considering the team finished at -2.5 BRR in 2014, we’ll take the wins where we find them.
Baseball Prospectus’ Baserunning Runs statistic has the team 7th in baseball at 4.2 BRR, which also happens to rank second in the American League.
If you’re allergic to small samples, now would be a good time to take a Benadryl before reading any farther. All but two Red Sox have had fewer than 80 opportunities to move the BRR dial in one way or another, and generally speaking, in most “opportunities,” most players would have the very same outcome. It’s also the nature of baserunning that a single player can throw team totals all over the place, as is the case if you subtract either Mookie Betts (4.4 BRR) or Pablo Sandoval (-3.7 BRR).
You can catch the stats for the whole team at BP, but I think it’s still fun to sort out some of the context and see not only that some players are fast, but by how by much. And while we await more data from StatCast to strip foot speed out of the equation, the BP stats (glossary) are also the best way to help figure out who runs smart. Report card time.
Wait, What Now?: Pablo Sandoval (F)
Here, “F” isn’t just a failing grade, but also a shorthand for the words he’s inspired while moving from station to station with intermittent success. His -3.7 BRR isn’t just the worst on the team by quite a lot; of 621 players to reach base this season, Sandoval’s baserunning has been worth the seventh least. Not great. We knew this wasn’t where Sandoval was going to do his damage (the good kind, anyway), but even in the context of his recent numbers out there (-4.7 BRR in 2014, -4.8 BRR in 2013), this is worse considering only half the season is in the tank.
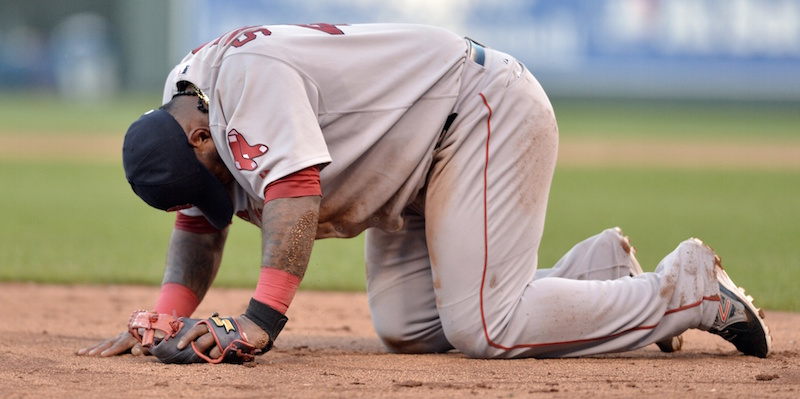
Photo by Denny Medley/USA Today Sports Images
Again, trying to extract meaning from samples this small is maybe a fool’s errand at best, but there might be an explanation here. Advancing on hits is an area in which the Red Sox tend to do well. Despite that -2.5 BRR total last year, they finished the season with a healthy positive in HAR (2.05). It doesn’t stick out like a sore thumb in every season, and yet it seems reasonable to suggest that Fenway Park may be an advantage. Will that ball scrape the Monster on its way down? A little experience in the park probably helps with something like that, especially since taking an extra base (e.g. third from first on a single) is mostly about making an early decision not to be tentative.
You see where I’m going with this. Sandoval’s -2.21 HAR is the only mark among Red Sox players below -0.55 HAR, and it’s the 4th-lowest in the game thus far (ahead of one first baseman and two DHs). Advancing on hits has not been a strong suit for Sandoval (-3.25 HAR, 2014; -1.96 HAR, 2013), and it’s unlikely to be in any of his seasons in Fenway. Still, we can lower the pitchforks even though this is our definition of a failing grade; we’re only talking 25 opportunities here, and maybe Sandoval is getting dinged by something that has a learning curve.
Not So Fast: David Ortiz (D)
Those two DHs that have done worse than Sandoval on advancing on hits? Neither of them is Ortiz! Papi has the second-worst BRR total on the team (-2.2 BRR), but you aren’t surprised by that. I still wanted to include him here because it’s kind of impressive that Ortiz is merely bad, and not terrible.
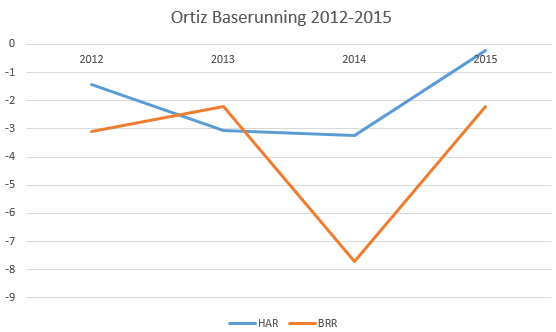
It’s still mostly a function of HAR: in 18 opportunities, the -0.20 HAR Ortiz has so far this season is strangely good considering his -3.23 HAR last year in exactly double the opportunities. Really, things just weren’t looking so hot for Ortiz before this season, in general.
Well done, Papi. Going from an F to a D helps the team as much as going from a B to an A.
Not What He Used to Be: Dustin Pedroia (C)
Pedey’s not doing so hot on the bases this year, with a -0.4 BRR in a team-leading 96 opportunities so far . He’s still doing good things out there on the dirt in nearly every way I could mean that, and with the most opportunities to advance an extra base on hits (43), he’s been a difference maker with HAR (1.73). He’s also done a pretty good job of not breaking off more than he can chew; since his injury-plagued 2010, he’s attempted fewer and fewer stolen bases in each of the last five seasons.
| Year | Number of Attempts | Success Rate |
| 2011 | 34 | 76% |
| 2012 | 26 | 77% |
| 2013 | 22 | 77% |
| 2014 | 12 | 50% |
| 2015 | 2 | 50% |
Pedroia also seems to have learned his lesson that he’s not the base stealer he once was after a 50/50 success rate last year (6 SB, 6 CS). If you can help the team with steals, great. But the man deserves some credit for policing himself (injuries may have “helped”), considering he was only caught six time in the first season in which he dipped below the league break-even point for success rate.
And there’s the catch: it may be time for Pedey to make another, similar adjustment. Solid negative scores on advancing on outs (-0.68 AAR on air outs, -1.57 GAR on ground ball outs) could be slowing him down, but he might need to reign it in even more. Baseball-Reference keeps an “Out On Bases” statistic, for outs other than in steal situations (which include pickoffs) and on force plays. A whopping six outs in this category may be a sign that Pedey can’t try to do as much as he used to, and that’s just enough for a passing grade.
Push it Some More: Xander Bogaerts (B)
If Pedroia might be trying to do too much, we might say that Bogaerts’s only real knock is not pushing the envelope more. He’s put up solid scores across the board with the exception of a slight negative in Air Advancement Runs, and even that is no albatross hanging around his neck; just as Fenway seems to hide a small HAR bonus, it’s harder in general to take an extra base by tagging up if you’re on the Red Sox. The extra hits created by the Monster may have been among the outs most likely to have resulted in an extra base.
Xander is not the guy at the head of the class so far this season, but he does rank second, just ahead of Brock Holt with a similar number of opportunities. He also leads the team in SBR, the portion of BRR that addresses stolen bases, caught stealings, and pickoffs. Yeah, 0.60 SBR isn’t a big advantage over Mookie Betts’s 0.41. But he’s done it in less than half the opportunities. Not bad, right?
With four steals in five attempts, could Bogaerts do more? We’re just one season removed from a 2-for-5 2014, and for what it’s worth, it looks like the Red Sox never really pushed him to learn. Between the minors and the majors, the most attempts that Bogaerts has ever made in a season is 11 (2013). It’s probably not as important as it might have been in the past, because Bogaerts is now hitting higher in the lineup, but maybe the Red Sox will start to push him more — and the second half of this year seems like a good time to try that.
Master of All Ways of Contending: Mookie Betts (A)
As if we didn’t already have enough to say about Betts, his 4.4 BRR this season puts him on track to end up around 9 BRR — a full win, just from baserunning. Betts has positive scores for all four of the main categories of BRR, including 3.07 for advancing on hits and just over 0.40 for the three others. There’s no weakness here, and it’s a continuation of last year, in which he added 3.2 BRR to the team’s group effort in slightly fewer opportunities (83 in 2014, 95 this year).
If we’re looking to nitpick, there are situations in which Betts probably could run more. Based on BP’s Run Expectancy Matrix for 2014 and comparing those numbers for before and after either stolen bases or caught stealings, we get these break even percentages:
| 0 Out | 1 Out | 2 Out | |
| 2nd | 66% | 74% | 66% |
| 3rd | 76% | 66% | 88% |
If a base stealer is capable of taking second 70% of the time, stealing or not stealing isn’t a very meaningful decision — and yet it could be “smart” with no outs or two, and not the best idea with one out. I don’t have an exact number for you, but batting leadoff most of the time has put Betts on second with one out fairly often; Betts has reached first base 17 times when leading off an inning, and he’s gotten moved over almost half the time he’s been on first with no outs, from what I can gather. He’s tried for third just once this season, and it did work out pretty well:
I’m going to go ahead and assume the decision to try stealing third didn’t come from the dugout for that one. Maybe, though, the Red Sox should consider giving Betts the green light to go for third if he’s standing on second base with one out — the break even point there is nearly identical for the ones for second and 0 or 2 outs. Still, Betts is doing everything he’s been asked, and he’s doing it well with no weaknesses. That’s an A in my book.
Top Photo by Greg M. Cooper/USA Today Sports Images
The opportunity to steal 3rd is gone over time and time again when the shift is on. Betts was mindful of the vacated area due to all the work done in spring training, and because the Sox shift so much themselves. He was lucky to get a good bounce on the throw, and just no hesitation whatsoever!